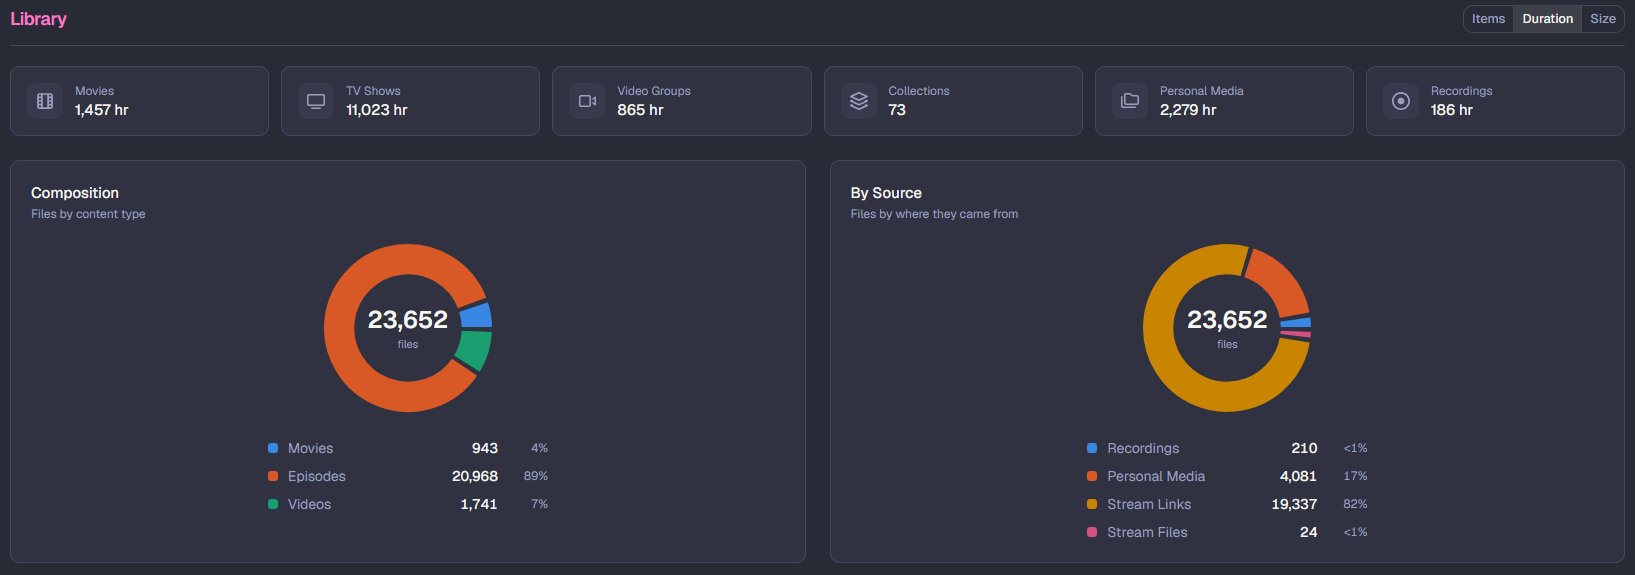
Thanks, yes, the dropdown exists and now has the fields to switch between, and that works for the numeric fields. However, the charts stay locked to file items:
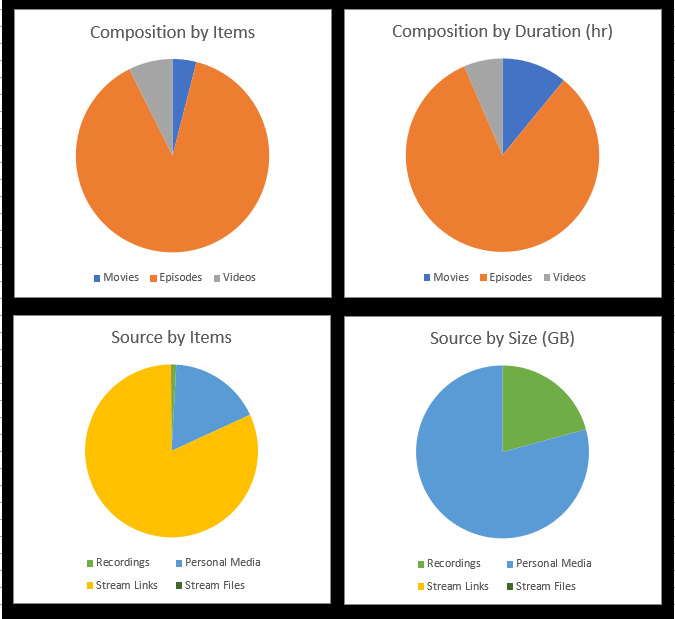
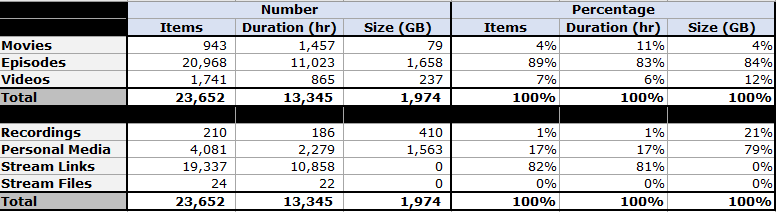
The "Composition" and "By Source" charts to update to what is in the dropdown, too. The charts were actually what the original request was focused on, too.
What actually happened:
They stay locked to "Files" (which it should say "Items" to match the dropdown).
As a ratio of the library, they mean totally different things. I have more episode files, but movies have much more duration. I'm almost completely Stream Links, but they take up no space compared to what recordings and personal media are doing.