
The other day I missed a couple of OTA recordings from my HDHomeRun tuner for some weird reason or another, and it wasn't until well after the fact that we were sitting down to watch that I realized it had failed. That started me searching for a way to get alerts from channels, but surprisingly I couldn't find anything.
I initially considering writing a small app I could throw into a docker container, but I was really just looking for something quick and dirty. That's when I remembered I was already using the Node-RED addon in my HomeAssistant install. I decided to try throwing together a quick flow that would poll the log endpoint, parse the log records, and alert me if issues were found.
After a couple hours of experimenting last night, I wound up with what seems to be a workable solution.
I setup a quick flow with 4 nodes:

The first one is an "inject" node to trigger the HTTP GET on an interval. I set it for every 2 minutes.

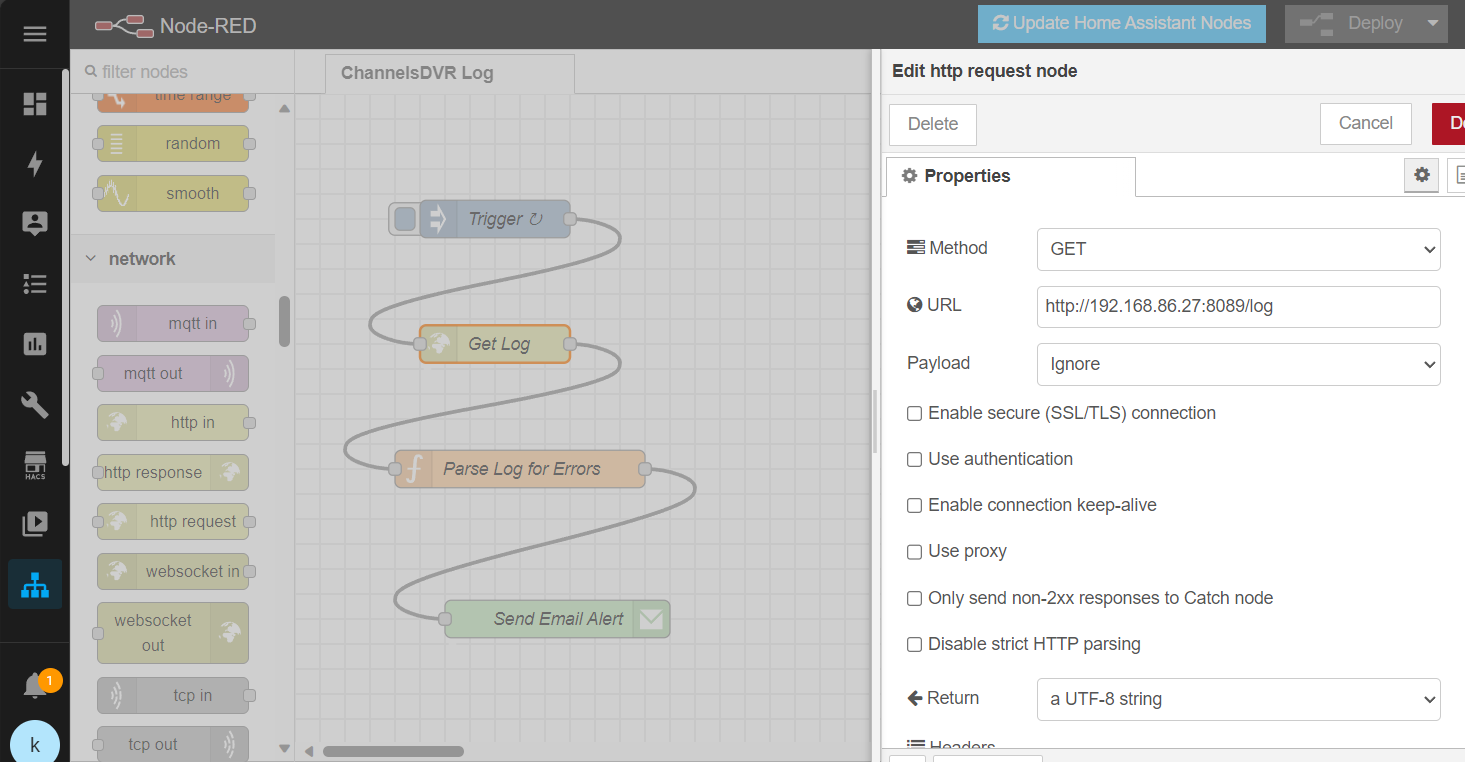
The next one is an "http request" node that performs the HTTP GET on the log endpoint. Notice it's not an api endpoint sadly, so it just returns a plain text (full) log each time.
Next is a "function" node for doing the log processing. I'll include the full code for it at the end.
The code basically parses the full log each time, looking for new log records that match the alert rules defined. If records are found, it collects them and passes them on to the next node in the flow. This is where things get interesting with it being Node-RED in HomeAssistant - you could easily trigger some home automation routine, send an alert to the HA app, send a txt, etc. At one point I had it flashing the lights, playing an audio message on my Google Home, and alerting via the app, but after some coaching from my wife  , I chose to simply send myself an email with the log records selected.
That leads me to the last "email" node. Reminder, if using gmail and you have MFA on your account, you'll need to create an "app password" to use instead of your normal account password.

Finally just Deploy the flow and wait for the emails to come in.
The full code I came up with for the function node that parses the log is below.
I chose to create a persistent, localfilesystem context store in Node-RED so the last processed log id wouldn't be lost between restarts, but if you don't want to fool with creating one you can simply leave the CONTEXT_STORE variable empty and it will default to the in-memory store. You might get some old alerts re-sent on a node-red restart, but no biggie.
The ALERT_RULES collection defines what you will be alerted for. You can simply define the log types (i.e. [ERR]) you want, and optionally some rules to match text in the log description. Specifically you can match on descriptions that "startsWith" some text, "contains" some text, "notContains" some text, or if you really want to get fancy you can do "regex" patterns (or a combination of all of them). I added the two in the code below because I wanted to know when jobs failed (mainly scheduled recordings), and any other ERR's as long as they weren't Pluto-related because it appears I regularly get 404's pulling pluto guide data.
/*
This code parses log records from ChannelsDVR log endpoint http://xxx.xxx.xxx.xxx:8089/log.
The logs are plain text and must be parsed into datetime, type, and description.
The log endpoint always returns a full log and must be polled, so we use a node-red context store
to keep track of the last log entry processed.
Log records matching the rules in ALERT_RULES will be collected and sent in a single message
on to the next node in the flow (to be sent via email).
The ALERT_RULES support selecting log records by the log type and optionally matching on the
description text using the following:
1) startsWith - where description starts with the given string
2) contains - where description contains the given string
3) notContains - where description does NOT contain the given string
4) regex - where description matches the regex pattern
*/
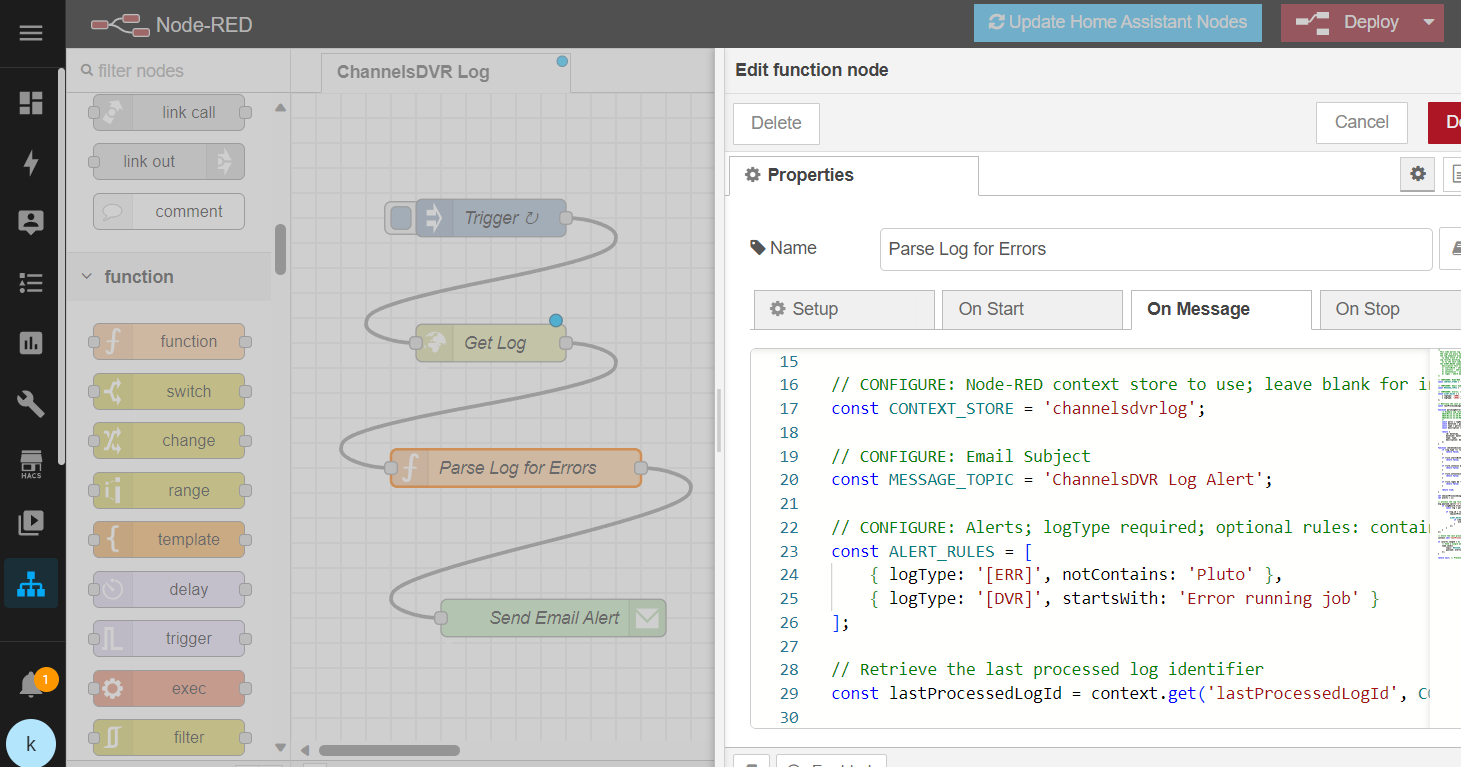
// CONFIGURE: Node-RED context store to use; leave blank for in-memory or specify name (if persistent/defined in settings.js)
const CONTEXT_STORE = 'channelsdvrlog';
// CONFIGURE: Email Subject
const MESSAGE_TOPIC = 'ChannelsDVR Log Alert';
// CONFIGURE: Alerts; logType required; optional rules: contains, notContains, startsWith, regex
const ALERT_RULES = [
{ logType: '[ERR]', notContains: 'Pluto' },
{ logType: '[DVR]', startsWith: 'Error running job' }
];
// Retrieve the last processed log identifier
const lastProcessedLogId = context.get('lastProcessedLogId', CONTEXT_STORE) || '';
function parseLogEntry(logEntry) {
/* Example Log records
2024/01/12 21:26:07.170332 [ERR] Failed to download XMLTV-Pluto: xmltv fetch: GET: https://i.mjh.nz/PlutoTV/us.xml: 404 Not Found: "404: Not Found"
2024/01/12 21:26:07.430336 [DVR] Fetched guide data for XMLTV-Plex in 259ms
2024/01/12 21:26:08.486562 [DVR] Indexed 612 airings into XMLTV-Plex (31 channels over 26h6m59s) + 71 skipped [746ms index]
*/
const parts = logEntry.split(' ');
const datetime = parts[0] + ' ' + parts[1];
const type = parts[2];
const description = parts.slice(3).join(' ');
return {
id: datetime,
datetime: datetime,
type: type,
description: description
};
}
function checkConditions(log, rule) {
if (log.type !== rule.logType) {
return false;
}
if (rule.startsWith && !log.description.startsWith(rule.startsWith)) {
return false;
}
if (rule.contains && !log.description.includes(rule.contains)) {
return false;
}
if (rule.notContains && log.description.includes(rule.notContains)) {
return false;
}
if (rule.regex && !rule.regex.test(log.description)) {
return false;
}
return true;
}
let newLastProcessedLogId = lastProcessedLogId;
let alerts = [];
// process the log records
msg.payload.split('\n').forEach(logRecord => {
if (logRecord.trim() !== '') {
const log = parseLogEntry(logRecord);
if (log.id > lastProcessedLogId) {
newLastProcessedLogId = log.id;
ALERT_RULES.forEach(rule => {
if (checkConditions(log, rule)) {
alerts.push(logRecord);
}
});
}
}
});
// Store the last processed log Id
context.set('lastProcessedLogId', newLastProcessedLogId, CONTEXT_STORE);
if (alerts.length > 0) {
// Send a single message with all selected log records concatenated
node.send({
topic: MESSAGE_TOPIC,
payload: alerts.join('\n')
});
}
return null; // Prevent further processing in this flow
Final thoughts:
- This could easily be wrapped up into a little node or .net app in a docker container instead of going the HA/Node-RED route.
- It would have been reaaaallly nice if there was an actual log api endpoint that returned JSON and even better if you could query it based on date/time so we wouldn't have to pull the full log each time.
- Even better would be some kind of pub/sub or webhooks support so we could just subscribe for the events instead of having to poll.

Curious what you guys think-