Massive Slowdown on Synology NAS

Hi, I am running Channels DVR Server on a Synology DS920+

For over a year it has been running fine, but as of yesterday there has been a massive slowdown and now android clients dont want to connect.

I can still connect using the web address on a PC, but it takes mins to load a page. And when scanning personal media it has gone from a task that used to take 1-2 mins to taking half a hour or longer. It is almost entirely unresponsive the whole time.

Any idea what has caused this? DSM is showing my hard drives as healthy still and no errors are being flagged.

edit: the only thing I can think of is I have used tubesync to add several hundred youtube recordings and have run the unofficial script to update the listings.

Take a look at Resource Monitor. How are the CPU/Network/Memory metrics looking?

laughable low. the normal 12%

That's probably not going to show you much. More likely is IO Wait or contention for multiple processes using the storage.

Are you running any scrub jobs? Do you have NVMe installed? What is your storage pool setup?

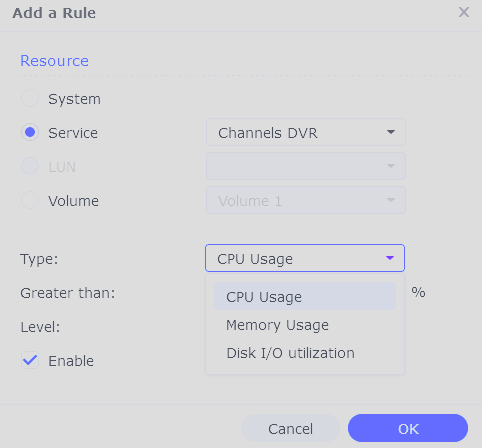
You can set up rules and alarms to help track down issues.


image

i have data scrubbing that ran last month but isnt scheduled to run again for several months.

I ran S.M.A.R.T. scans on all the drives to see if there were any issues and they all came back healthy.

I have created the rules for warnings above 80% for CPU, Memory, and I/O for the volume

thanks for the help, im out of ideas

@dschaper is totally right to be looking at the IO metrics.

If you open the Performance tab in Resource Manager and look at the Disk and Volume tab and under the Type of Utilization you can see in realtime how the utilization is.

2 Likes


the utilization seems high but not hugely different from the historical norm. Im open to ideas as to why the channels app suddenly changed so much.


Thanks for the help. Its nice having a community with knowledgeable people willing to share their expertise and time.

I noticed the slowdown on the DS220plus configuration.
I went through and replaced my network cable and turned off re==/removed some docker containers.
I was running some beta versions of different containers and kept applying updates.
Thenks seemed to have returned to normal.

@TexasYeti wow, that utilization looks bad.

If you go to the Disk tab with the Utilization type, try hitting that "Custom View" button and select all of your disks.

You can see if one of the disks is causing you more issues than the others.

First, thanks again, i think we're getting somewhere.

Sadly, my graphs look like an impressionist painting.

I noted that both drive 1 and 2 were at 100% while the resource monitor was on.

Just to renote; I ran a smart scan on all drives this morning and they didnt find any issues.

Looks like you may want to consider replacing your small drives with faster drives. Alternatively, the SSD acceleration may help you here.

i guess i dont understand why this just recently became an issue? any idea? all 4 drives seem to have similar read and right speeds.

Just a shot in the dark here (I'm running a DS423+ and an old 218) but do you use the Active Insight application? It's installed and it runs in the background but it can do things like keeping drives from spinning down with its constant polling. Can you try going in to your Package Center and uninstalling that package?

Options to further troubleshoot exist but they mostly use shell access (SSH access) in to the NAS and running things at the command line.

$ iostat
Linux 4.4.302+ (DS423Plus)      03/13/24        _x86_64_        (4 CPU)

avg-cpu:  %user   %nice %system %iowait  %steal   %idle
           7.16    0.54    2.92    1.52    0.00   87.85

I like to use netdata running in a container in my NAS. It has tons of ways to look at performance issues. The trick is in understanding all the data :wink: I'm no expert but I found some of the screens useful. Here the portainer compose file I use:

version: "3.6"
services:
  netdata:
    container_name: "netdata1"
    entrypoint:
      - "/usr/sbin/run.sh"
    environment:
      - "PATH=/usr/local/sbin:/usr/local/bin:/usr/sbin:/usr/bin:/sbin:/bin"
      - "NETDATA_OFFICIAL_IMAGE=true"
      - "DOCKER_GRP=netdata"
      - "DOCKER_USR=netdata"
      - "NETDATA_LISTENER_PORT=19999"
    hostname: "00f8266d72df"
    image: "netdata/netdata"
    ipc: "private"
    labels:
      org.opencontainers.image.authors: "Netdatabot <[email protected]>"
      org.opencontainers.image.description: "Official Netdata Agent Docker Image"
      org.opencontainers.image.documentation: "https://learn.netdata.cloud"
      org.opencontainers.image.source: "https://github.com/netdata/netdata"
      org.opencontainers.image.title: "Netdata Agent"
      org.opencontainers.image.url: "https://netdata.cloud"
      org.opencontainers.image.vendor: "Netdata Inc."
    logging:
      driver: "db"
      options: {}
    mac_address: "02:42:ac:11:00:06"
    network_mode: "bridge"
    ports:
      - "19999:19999/tcp"
    restart: "unless-stopped"
    security_opt:
      - "apparmor=unconfined"
    volumes:
      - "/sys:/host/sys:ro"
      - "netdatacache:/var/cache/netdata"
      - "netdatalib:/var/lib/netdata"
      - "netdataconfig:/etc/netdata"
      - "/etc/group:/host/etc/group:ro"
      - "/etc/os-release:/host/etc/os-release:ro"
      - "/etc/passwd:/host/etc/passwd:ro"
      - "/proc:/host/proc:ro"
volumes:
  netdatacache:
    external: true
  netdataconfig:
    external: true
  netdatalib:
    external: true
2 Likes

just posting that this fixed it for anyone stumbling onto this thread via search in the future

Im not sure why it wasnt an issue before, maybe the old drives just weren't filled to a level that caused issues previously but this was the fix.

It became especially obvious when i looked up the smaller IronWolf drives and saw that they were only 5900 RPM with a tiny 64MB Cache.

replacing both with 7200 RPM / 256MB Cache drives has every drive running at the same speed with the same cache and the system is performing great again.

thanks for everyones help. I learned a lot.